Archives for May 2018

May 22nd Daily Market Comments

Today’s lack of direction in the markets are not changing the J-Hook Pattern potential in the indexes. Although the Dow is trading lower, the transportation index is trading higher, indicating no major change of investor sentiment. The lack of any change of investor sentiment allows for strong candlestick chart patterns to continue to work.

Share

Options Pricing: It’s Like Buying in Bulk

Options Pricing: It’s Like Buying in Bulk
By Bill Johnson

One of the benefits of options is that we get lots of choices. We have lots of expiration dates, strikes, and strategies. Unfortunately, having so many choices also causes confusion among traders. Which expiration and which strike should you choose?

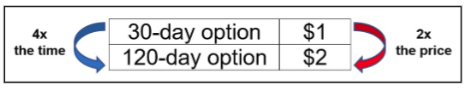
To answer that, it helps to understand some basics of options pricing. Most traders believe that at-the-money option prices follow a straight-line path. For instance, if a one- month option costs $1, you’d think a two-month option must cost $2 – twice the time, twice the money. It seems to make sense, but it’s wrong. Not understanding how options are priced leads traders to make bad strategy decisions.

It’s counterintuitive, but here’s the way it works: If a one-month option costs $1, it would take a four-month option before you’d see it trading for $2. In other words, it takes four times the amount of time to double an option’s price. The reason is that options prices are proportional to volatility, which is proportional to the square root of time.

If you increase time by a factor of four, the option’s price increases by the square root of four, or a factor of two. If you can increase in option’s time to expiration nine-fold, the option’s price triples.

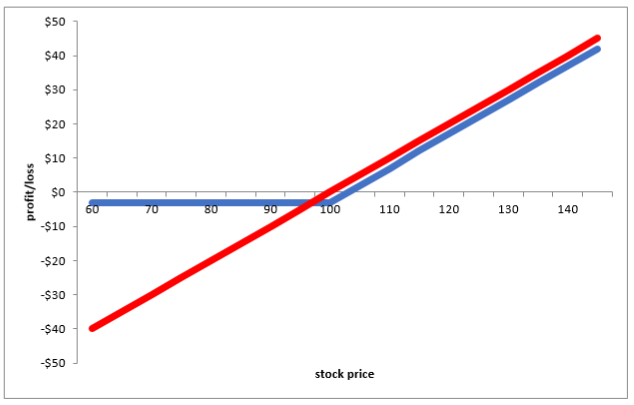
The point to understand is that when you’re buying long-dated options, it’s like buying things in bulk. Yes, you’ll pay more for the option, but the price per day is greatly reduced. For instance, the four-month option trading for $2 costs about 1.7 cents per day, but the one-month option trading for $1 costs about 3.3 cents per day – twice as much. If you’re buying options, you should lean toward buying longer-dated options as the amount of time value you’re spending per day is greatly reduced.

On the other hand, option sellers should lean toward selling shorter-term options multiple times rather than selling one longer-dated option. For example, if you’re using a covered call strategy, you may decide to sell the four-month option for two dollars. It sounds like a better deal since you’re receiving $2 rather than $1. However, you must wait the entire four months before you’ll collect it all. On the other hand, if you sell the one-month option four times, you’ll collect $4 – twice as much money for the same length of time.

Unfortunately, many new traders think longer dated options are riskier because they cost more money in total. However, you must always ask yourself how much am I paying per day? When you look at options in this light, longer dated options are always far cheaper. For a live example, Apple Computer (AAPL) closed today at $187.63. If you decided to sell the January 2019 $190 call (242 days to expiration), you’d receive $12.30. However, if you sold the $190 weekly that expires in four days, you’d get 54 cents. Instead, if you sold the 4-day call, you could do that 60 times during the same 242 days, which would net a total of $32 – far greater than $12.30.

There are other considerations, such as the size of the hedge. If Apple takes a big hit, you may have been better off having sold the longer-dated option. But all things being equal, you should buy longer-dated options and sell shorter-dated ones. The square-root pricing relationship is the reason. All options strategies are always about tradeoffs, so there’s never a crystal-clear answer as to what the best strategy may be. Instead, you want to focus on which strategy is best for you. Once you understand how options are priced, it puts you one step closer to mastering the art and science of options trading.

Good Investing!

Bill Johnson, Steve Bigalow
and The Candlestick Forum Team

P.S. Bill Johnson’s Alpha Trader Options Course takes you from the very beginning, step-by-step, through an exciting journey into the world of options. At the end, you’ll have the necessary knowledge and confidence to start investing and hedging with options. In addition, you’ll have a rock-solid foundation from which to continue your options education.

Click here for more information about Bill’s Alpha Trader Options course, now with multi-pay options!

Share

May 21st Daily Market Comments

The gap up strength in today’s trading illustrated the T-line was going to act as a support level. It also shows a strong bullish sentiment starting the third wave of a J-hook pattern. This would imply the next bullish leg is in progress. As long as the days trading remains above Today’s open, the probabilities of more upside remain extremely strong. Any short positions in the portfolio should be showing compelling weakness.


Share

The Hidden Dangers of Automatic Exercise

The Hidden Dangers of Automatic Exercise
By Bill Johnson

Options strategies are highly rewarding, but like any field, there are rules and procedures you must understand. One of the most misunderstood – and potentially dangerous – is automatic exercise.

When you buy an option – call or put – you have the right, not the obligation, to exercise the option. If you exercise a call option, you’ll buy 100 shares of stock and pay the strike price. On the other hand, if you exercise a put option, you’ll sell 100 shares of stock and receive the strike price. You’re not required to ever exercise a long option. It’s simply a right if you choose. Most the time, options traders just close their options in the open market and take their profits that way. Still, some traders may want to buy or sell shares of stock by exercising an option, and they’re certainly free to do that.

However, there is a procedure set by the Options Clearing Corporation (OCC) that can potentially change that decision. If any option is at least one cent in the money, it is automatically exercised unless you instruct the broker to not do so. For example, let’s say you own the $100 call, and the stock closes at $100.01 or higher at expiration. If you didn’t close at call out at expiration, it will automatically be exercised, and that means you’re going to own 100 shares of stock on Monday morning. On the other hand, if you own a $100 put and the stock closes at $99.99 or lower, you’ll end up selling 100 shares of stock from your account. If you don’t have the stock in the account, you’ll be short 100 shares of stock. What if you don’t have to cash in the account to maintain the long or short stock positions?

Most brokers will still exercise the options, and you’ll owe at least a 50% margin requirement to continue holding the position. Some brokers, however, will close the position if you don’t have the cash, so it’s important to understand your broker’s policies.

Losing More Than What You Paid

The main danger with automatic exercise is that it creates the potential for you to lose more on the option than the amount you paid. You often hear that the most you can lose on an option is the amount you paid, and that means the option itself cannot have negative value. However, because of this man-made rule of automatic exercise, it’s not totally true.

Here’s an example of how things can go wrong if you don’t understand option mechanics. Let’s say you bought a $100 call for $3, or a total of $300. On expiration Friday, the stock is trading for $99.50, and it looks like it’s going to expire worthless. Rather than paying the commission to close it out, you take off for the golf course. However, in the last few minutes of trading, news breaks out, and the stock closes above $100. Because you didn’t close out the option, you’re going to be long 100 shares of stock on Monday morning. Now let’s say the stock trades at $95 on the opening bell. You own shares at $100, but if you don’t want the shares in your account, you’re going to end up selling them for the current market price of $95. Therefore, you ended up with a $500 loss, even though you only spent $300 on the option. The reason this happens is the long $100 call has a limited downside risk of $3 – the amount you paid. It’s profit and loss diagram looks like a hockey stick as shown by the blue curve in the chart below:

However, if you end up exercising that call, whether intentionally or through automatic exercise, your profit and loss diagram is no longer represented by the blue curve. Instead, you’re now long shares of stock and have an unlimited downside risk as shown by the red line.

The lesson to learn is that if you have any long options that are even remotely close to becoming in the money at expiration, close them out. If your proceeds are not enough to cover commissions, most brokers will call it even. If your broker won’t, you can always place instructions to not exercise any long options that may end up going in the money. If you either close out the long positions or instruct the broker to not exercise them, now it’s safe to go to the golf course. Options aren’t risky if you understand all the rules. As Warren buffet said, risk comes from not knowing what you’re doing. If you understand the art and science of options trading, they’ll become invaluable tools for hedging risk and holding on for bigger gains.

Good Investing!

Bill Johnson, Steve Bigalow
and The Candlestick Forum Team

P.S. Bill Johnson’s Alpha Trader Options Course takes you from the very beginning, step-by-step, through an exciting journey into the world of options. At the end, you’ll have the necessary knowledge and confidence to start investing and hedging with options. In addition, you’ll have a rock-solid foundation from which to continue your options education.

Click here for more information about Bill’s Alpha Trader Options course, now with multi-pay options!

Share

May 18th Daily Market Comments

Today’s lethargic trading is making most individual stock prices trading lethargicly. Although the markets are trading indecisively, they are still using the T-line as an ultimate support level. Today will probably be a very boring day to trade/watch. Continue to hold long positions that are not showing any relevant selling/candlestick sell signals.

Share

Trending Stocks: BZUN, VLO

Baozun (BZUN)

Chart for BZUN

Over the next 13 weeks, Baozun has on average historically risen by 62.8% based on the past 2 years of stock performance.

Baozun has risen higher by an average 62.8% in 2 of those 2 years over the subsequent 13 week period, corresponding to a historical probability of 100%

The holding period that leads to the greatest annualized return for Baozun, based on historical prices, is 19 weeks. Should Baozun stock move in the future similarly to its average historical movement over this duration, an annualized return of 394% could result.

Valero (VLO)

Chart for VLO

Over the next 13 weeks, Valero has on average historically fallen by 6.1% based on the past 20 years of stock performance.

Valero has fallen lower by an average 6.1% in 14 of those 20 years over the subsequent 13 week period, corresponding to a historical probability of 70%

The holding period that leads to the greatest annualized return for Valero, based on historical prices, is 48 weeks. Should Valero stock move in the future similarly to its average historical movement over this duration, an annualized return of 26% could result.

Share

May 17th Daily Market Comments

The T-line continues to act as a support level. The Dow and S&P 500 have already used it once again Today as a support before starting to head higher. The J-hook pattern is becoming evident in the major indexes. Continue to stay long as long as these market indexes remain above the T-line. The oil stocks are still producing good profits.


Share

Support Breakouts & Resistance Breakouts Workshop Replay

“Top Patterns Working in Today’s Market Conditions”
4-hour Online Training Workshop – Saturday, June 23rd, 2018

Click here for more information.


Share

Scoop Pattern & Cradle Pattern Workshop Replay

“Top Patterns Working in Today’s Market Conditions”
4-hour Online Training Workshop – Saturday, June 23rd, 2018

Click here for more information.


Share

May 16th Daily Market Comments

Although the markets are not trading up with any great resiliency Today, Today’s positive trading implies yesterday’s pullback to the T-line was merely a pullback. Until there is a confirmed sell signal AND a close below the T-line, it has to be assumed based upon probabilities the uptrend is remaining in progress. Stay predominantly long with specific sectors such as oil and biotech’s showing the strongest sector moves.

Share