Archives for February 2012

Doji

The Doji signal is one of the most revealing signals of the candlestick patterns. It clearly indicates that the Bulls and the Bears are at equilibrium or a state of indecision. When it appears at the end of an extended trend it has significant implications that the trend may be ending. The Japanese say that whenever this signal appears to always take notice. In other words, when a Doji appears at the top of a trend, especially in an overbought area, you should be prepared to close your trade. Conversely, when this signal is seen at the bottom of an extended downtrend, it requires buying signals the next day to confirm the reversal. Otherwise, the weight of the market could take the trend lower.

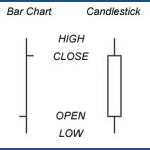
The Doji signal is comprised of one candle. It is formed when the open and the close occur at the same level or very close to the same level in a specific timeframe. This essentially creates a cross formation.

As the illustration above demonstrates, the horizontal line represents the open and close occurring at the same level. The vertical line represents the total trading range during that time. Upon seeing this signal in over-bought or oversold conditions, (over-bought or oversold conditions can be defined using other indicators such as stochastics); there becomes an extremely high probability reversal situation. When this signal appears it is demonstrating that there is indecision now occurring at an extreme portion of a trend. It is important to note that this indecision can be portrayed in a few variations.

Criteria for a Doji Signal

  •  The open and close are the same or nearly the same
  • The length of the shadow should not be excessively long, especially when viewed at the end of a bullish trend.

Doji Signal Enhancements

  •  A gap away from the previous day’s close sets up for a stronger reversal move.
  • Large volume on the signal day increases the chances that a blow-off day has occurred although it is not a necessity.
  •  It is more effective after a long candle body and is usually an exaggerated daily move compared to the normal daily trading range seen in the majority of the trend.

Recognizing and understanding the psychology that forms the major candlestick patterns will provide completely new insights for investors to understand optimal times to buy and sell. Japanese rice traders realized that prices do not move based on fundamentals but instead that they move based on the investor perception of those fundamentals. The Doji signal is one of the most predominant reversal indicators. It is very effective in all-time frames whether using a one-minute, five-minute, or fifteen-minute chart for day trading or daily, weekly, and monthly charts for the swing trader and long-term investor.

Continue to read about another signal called the Bearish Engulfing Signal.

Share

Candlestick Patterns

Candlestick patterns are clear and easy to identify demonstrating highly accurate turns in investor sentiment. Japanese candlestick patterns consist of approximately 40 reversal and continuation patterns which all have credible probabilities of indicating correct future direction of a price move. However the twelve major candlestick patterns provide more than enough trade situations to most investors. There are only twelve major patterns that should be committed to memory but this does not mean that the remaining secondary patterns should not be considered. In fact those signals are extremely effective for producing profits. Reality however demonstrates that some of them occur very rarely.

Candlestick trading analysis does not require knowing intricate formulas or ratios and it does not require massive amounts of education to effectively utilize the signals. The signals and patterns are easy to see as illustrated below. As you can see a stock price closing higher than where it opened will produce a white or green candle. A stock price closing lower than where it opened creates a black or red candle. The boxes that form are called “the body” and extremes of the daily price movement are represented by the lines extending from the body. These lines are called shadows or tails. When a stock price closes where it opened or very close to where it opened, it is called a “doji.” A hollow candle forms when the stock closes higher than its opening price and a solid (or filled) candle forms when the stock closes lower than its opening price.

The twelve candlestick patterns illustrate the major signals. The definition of “major” means two things. First, they occur in price movements often enough so that they are beneficial to producing a supply of profitable trades. Second, they clearly indicate price reversals with strength enough to warrant placing trades. The twelve major candlestick patterns are listed below and as you can see each candle formation has a unique name. Some have Japanese names while others have English names.

Twelve Major Candlestick Patterns: Doji, Bullish Engulfing, Bearish Engulfing, Hammer Signal and Hanging Man, Piercing Pattern, Dark Cloud Cover, Bullish Harami, Bearish Harami, Morning Star, Evening Star, Kicker Signals (Bearish and Bullish), Shooting Star, and Inverted Hammer.

The average investor does not have to be dependent on the investment professional when utilizing candlestick patterns. Professional recommendations are not always in your best interest at the forefront. Whether totally unfamiliar with investment concepts or very sophisticated in investment experience, the Japanese Candlestick trading formations are easily utilized. The signals and patterns are easy to see and their interpretations are reliable.

Continue to read about the Doji which is one the most revealing candlestick signals.

Click here to learn how you can Profit ‘Big-Time’ From Trading With Candlesticks

Learn more about the member benefits included in my Candlestick Forum Membership package.

Share