Archives for May 2018

May 31st Daily Market Comments

The Dow continues to show indecisiveness but note that the low of Today supported right on the 50 day moving average. The NASDAQ is showing the most strength, currently trading positive after yesterday’s Doji gap up above the resistance level.

Share

Trending Stocks: WVE

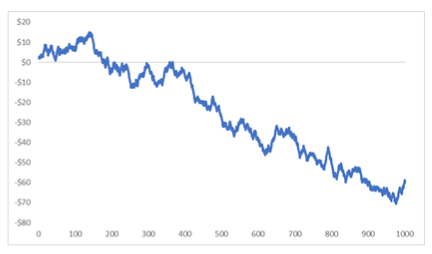
WAVE Life Sciences (WVE)

Chart for WVE

Over the next 13 weeks, WAVE Life Sciences has on average historically risen by 12.8% based on the past 2 years of stock performance.

WAVE Life Sciences has risen higher by an average 12.8% in 1 of those 2 years over the subsequent 13 week period, corresponding to a historical probability of 50%

The holding period that leads to the greatest annualized return for WAVE Life Sciences, based on historical prices, is 27 weeks. Should WAVE Life Sciences stock move in the future similarly to its average historical movement over this duration, an annualized return of 218% could result.

Share

May 30th Daily Market Comments

The Dow is forming a bullish Harami off the 50 day moving average. The S&P 500 is doing a kicker type signal and trying to climb back up above the T-line. The positive open in the NASDAQ after yesterday’s Doji right on the T-line has gapped up through the downtrending resistance level. If the markets remain positive going into the close today, each index will have shown support at viable technical levels, making the prospects of a further uptrend much more compelling. Stay predominantly long, many J-hook patterns are working well.


Share

Trading the Mark: The Hidden Importance of Fair Value

Trading the Mark:The Hidden Importance of Fair Value
By Bill Johnson

Vincent Van Gogh said, “Great things are done by a series of small things brought together.” Investing works much the same way, and financial success comes from doing a lot of small things correctly. Options, however, have a lot of moving parts, and it’s easy to overlook the things you can’t see. One of the biggest mistakes I’ve seen with new options traders – and experienced ones – is misunderstanding the importance of fair value.

Fair value is a financial concept, which is simply a price that neither benefits the buyer nor the seller in the long run. In other words, it’s a price that’s fair to both parties. If the price always benefited the buyer, traders would bid the price higher until that benefit was priced away. On the other hand, if the price always favored the seller, more sellers would enter the market, push prices lower, and eventually that benefit would disappear. But when we reach a balancing point and have a price that doesn’t benefit either party in the long run, it’s a fairly-valued asset.

To understand the concept of fair value, consider a coin toss. If I toss a coin and offer to pay you one dollar if it lands heads, you should be willing to pay me one dollar if it lands tails. If you do, neither of us would be expected to come out ahead if we played this game thousands of times. We would expect to just break even in the long run.

However, if you paid me just slightly more, say $1.05 each time it lands tails, it would no longer be fairly valued, and I would have a long-term edge. In fact, if we played this game one thousand times, you’d end up on the losing side of the bet, as shown in computerized simulation below:

In other words, because you’re paying more than fair value, you’re heading into a financial black hole. No matter what strategies you try, or what methods you concoct, you’re going to lose money. It’s like the old business school joke of the guy who sold inventory at a loss but tried to make up for it in volume. The more you play the game, the deeper in debt you go.

The concept of fair value is exactly what allows casinos to win in the long run. Casinos make money by paying off winners at less than fair value. If you win $1,000 at roulette, it might look like you came out ahead, but if you compared it to the odds you overcame to win that money, you were short changed. Contrary to popular belief, it is the winners who pay for the pleasure of gambling. In other words, the winners actually lose. The idea to understand is that when you pay above fair value or receive less than fair value, it’s a little thing that magnifies into big losses.

Options trading works the same way. Every options contract has a fair value, which can be found through a pricing model. Most platforms will show them as the “mark,” or the midpoint between the bid and the ask. However, most traders get impatient and buy their options at the asking price and sell them on the bid. Doing so, however, you subject yourself to a house edge on the way in – and on the way out. Without even counting the effects of commissions, it’s most likely going to lead to long-term losses. For instance, look at the screenshot of the Nvidia (NVDA) quotes below:

The stock was trading for $250, and the $250 call had a mark of $10, as shown in the third column. However, if you bought the option on the asking price (column 2), you’d pay $10.10, or 10 cents higher than fair value. On the other hand, if you sold the option for the $9.90 bid (column 1), you received 10 cents less than fair value. It seems like a small thing, and it probably is for a trade here or there. But if you keep buying on the asking price and selling at the bid, those little things add up to big losses. To make great strategies come alive, you must do a lot of little things well. Start by placing your options orders as limit orders at the mark. Be patient. If it doesn’t fill, it’s a missed opportunity, but that’s better than a filled order above fair value.

Options traders have a host of strategies available to them that simply aren’t available to stock traders. By using options, traders can hedge, roll, and morph positions, which allows them to stay in trends much longer than they would be willing to by using shares of stock. That’s where the big money lies. It’s exciting – and rewarding. But to master the art and science of options trading, you can’t just focus on the big strategies. To make them great, you must bring small things together.

Good Investing!

Bill Johnson, Steve Bigalow
and The Candlestick Forum Team

P.S. Bill Johnson’s Alpha Trader Options Course takes you from the very beginning, step-by-step, through an exciting journey into the world of options. At the end, you’ll have the necessary knowledge and confidence to start investing and hedging with options. In addition, you’ll have a rock-solid foundation from which to continue your options education.

Click here for more information about Bill’s Alpha Trader Options course, now with multi-pay options!


Trading in the Stock Market, Trading Options, Trading Futures, and Options on Futures, involves substantial risk of loss and is not suitable for all investors. Past Performance is not indicative of future results. CandlestickForum.com, Candlestick-Trading-Forum.com, StephenBigalow.com, and Candlestick Forum LLC do not recommend or endorse any specific trading system or method. We recommend that you research all trading systems, methods and market strategies thoroughly. Full Disclaimer here

Share

May 29th Daily Market Comments

The market analysis remains consistent today as with the past few weeks of trading. Although the indexes are not showing consistent strength across-the-board, they are also not showing any consistent weakness. The Dow and S&P 500 are trading below the T-line showing the likelihood of trading back to the 50 day moving average support level while the NASDAQ continues to trade above the T-line. Specific sectors are providing good profitability. The retailers on the long side. Oil stocks on the short side. Candlestick charts easily illustrate which sectors to be long or short.

Share

Trending Stocks: RGNX

Regenxbio (RGNX)

Chart for RGNX

Over the next 13 weeks, Regenxbio has on average historically risen by 7.2% based on the past 2 years of stock performance.

Regenxbio has risen higher by an average 7.2% in 2 of those 2 years over the subsequent 13 week period,corresponding to a historical probability of 100%

The holding period that leads to the greatest annualized return for Regenxbio, based on historical prices, is 21 weeks. Should Regenxbio stock move in the future similarly to its average historical movement over this duration, an annualized return of 154% could result.

Share

May 25th Daily Market Comments

The transportation index and the NASDAQ continue to trade positive. This indicates the lack of any consensus of selling in the markets. Crude oil is down two dollars on the day. These market conditions still indicate that each individual sector should be bought or sold based upon its own merits. Obviously, the oil stocks are in a sell mode. The big tech stocks are showing bullish sentiment. Continue to stay predominantly long and take profits when specific stocks/sectors start rolling over.


Share

May 24th Daily Market Comments

Political events continue to keep the market in a sideways mode. This lack of direction for the overall market continues to put more emphasis on each individual stock chart. Continue to stay predominantly long but be aware that world political decisions will be adding to specific sectors or detracting from specific sectors. For example, today the defense stocks and gold stocks are reacting to the positive side. Utilize the candlestick charts to pinpoint which sectors are getting good strength.

Share

Trending Stocks: CTRP, RL

Ctrip (CTRP)

Chart for CTRP

Over the next 13 weeks, Ctrip has on average historically risen by 11.5% based on the past 14 years of stock performance.

Ctrip has risen higher by an average 11.5% in 9 of those 14 years over the subsequent 13 week period, corresponding to a historical probability of 64%

The holding period that leads to the greatest annualized return for Ctrip, based on historical prices, is 1 week. Should Ctrip stock move in the future similarly to its average historical movement over this duration, an annualized return of 186% could result.

Ralph Lauren (RL)

Chart for RL

Over the next 13 weeks, Ralph Lauren has on average historically risen by 5.4% based on the past 20 years of stock performance.

Ralph Lauren has risen higher by an average 5.4% in 11 of those 20 years over the subsequent 13 week period, corresponding to a historical probability of 55%

The holding period that leads to the greatest annualized return for Ralph Lauren, based on historical prices, is 13 weeks. Should Ralph Lauren stock move in the future similarly to its average historical movement over this duration, an annualized return of 22% could result.

Share

May 23rd Daily Market Comments

After opening lower Today, the market indexes are currently trading above where they opened. This reveals that although the markets are lower, there is still buying occurring at these levels. The T-line remains a relevant factor. The indexes are hovering at the T-line level. It will be important to see whether the T-line holds as a support today. Stay predominantly long but a close below the T-line at the end of the day would warrant taking some long positions out of the portfolio.


Share